(001)
BMS + Solar Monitor
EV Battery, Solar & Location Monitoring with Mobile Sync
- Role
- Full-Stack Developer
- Year
- 2025
- Stack
- ElectronReactTypeScriptViteTailwind CSSSerialPortMapLibre GLFirebase RTDBExpressElectron Builder
(002)
Overview
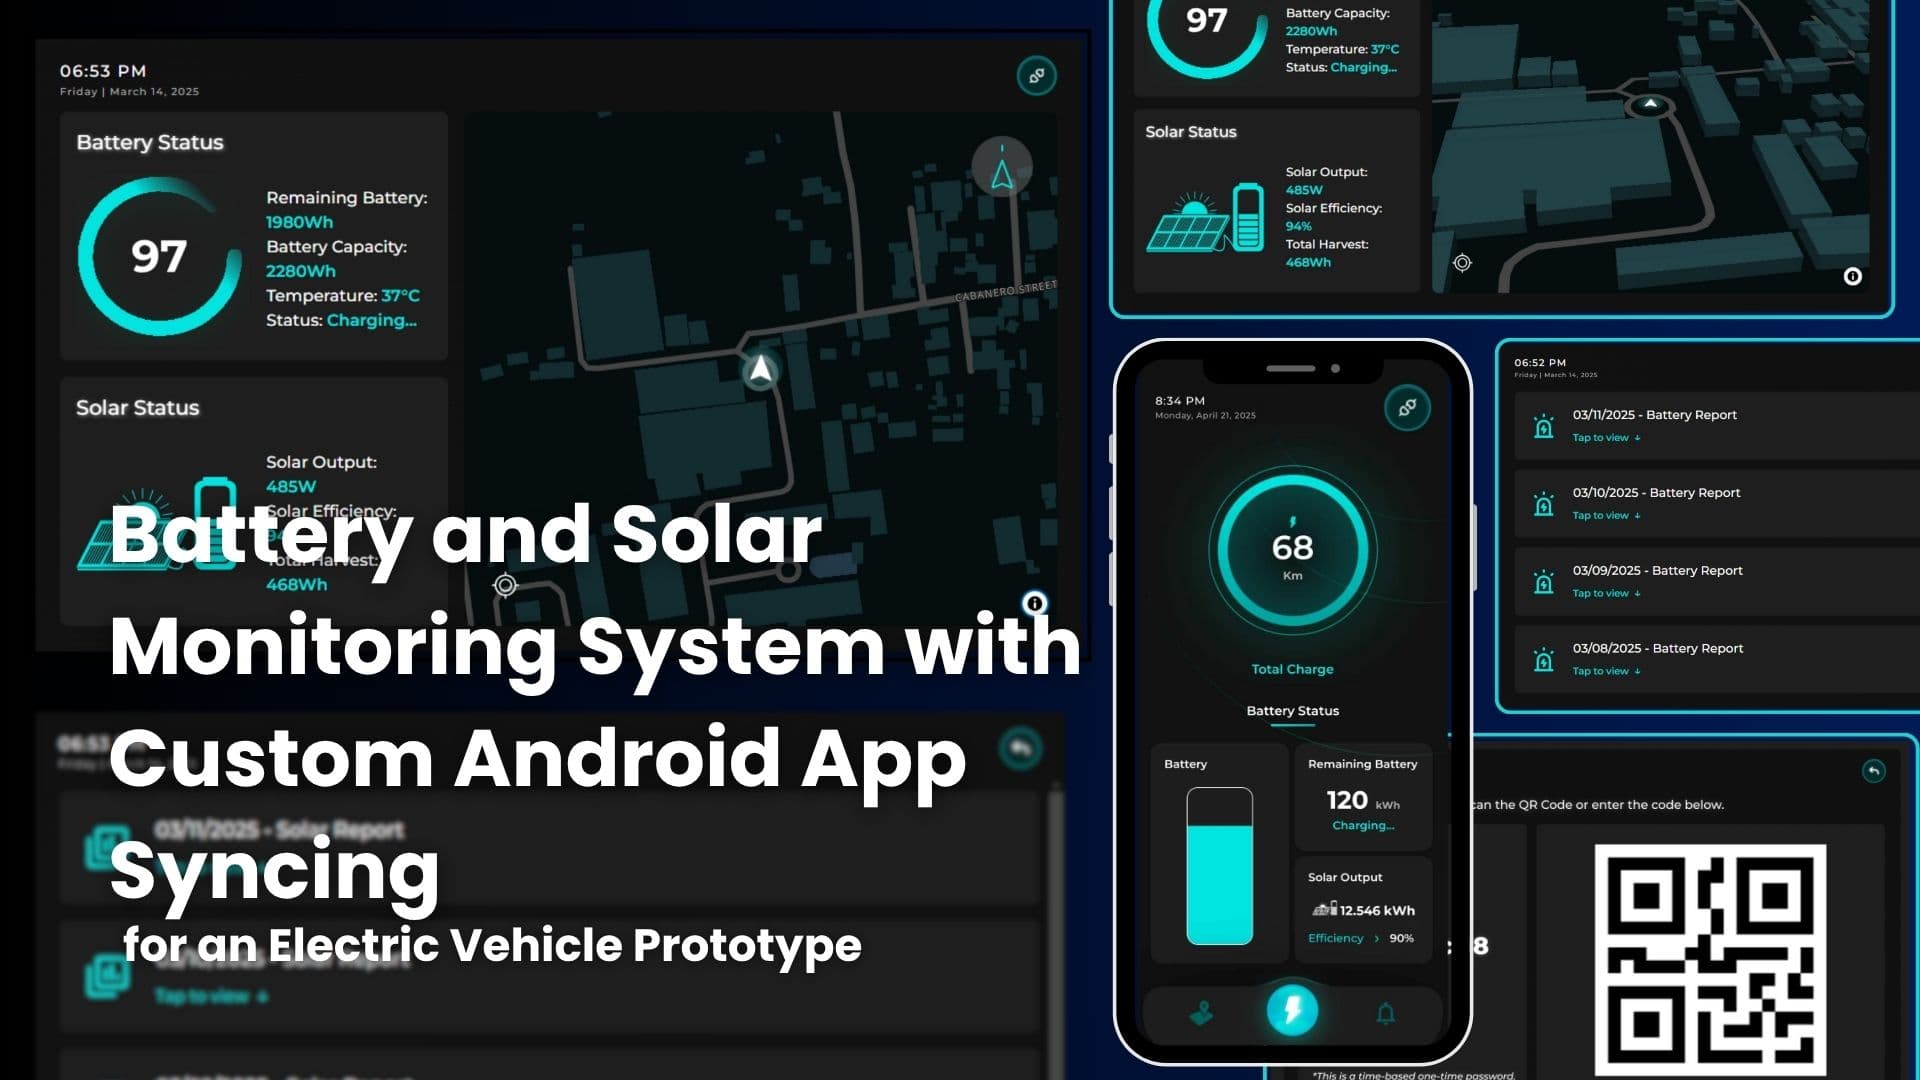
A commissioned desktop monitoring application for BSAMT undergraduates at WCC. It lets operators observe an electric vehicle's location, battery condition, and solar-generation performance from a single kiosk-style dashboard, while syncing key data for smartphone access.
I built the layer between the hardware telemetry and the people reading it. The app pulls sensor and GPS streams off the vehicle's serial ports and converts them into readable metrics.
(003)
The Challenge
An electric vehicle with a solar charging system generates several streams of information: battery voltage, current, temperature, solar output, and GPS coordinates. Without a central interface, an operator cannot read vehicle health, energy availability, and location at once.
The application had to make all of that readable in real time on the vehicle display, keep a usable record of it, and stay in sync with a phone without hammering the cloud database.
(004)
What I Built
A full-screen Electron desktop application that connects directly to vehicle hardware through serial ports, transforms raw sensor readings into useful metrics, and presents them in a focused React dashboard:
- Real-time battery status: state of charge, remaining energy, average pack temperature
- Solar power output, estimated panel efficiency, and charging status
- Live GPS tracking on an interactive MapLibre map
- A navigation mode with map pitch and 3D-building visualization
- Local hourly snapshots and automatic daily battery and solar reports
- Firebase Realtime Database sync for telemetry, location, reports, and notifications
- A time-limited QR-code pairing flow for connecting a smartphone to a vehicle
Raw readings become practical measurements before the app displays or stores anything: state of charge from pack voltage, remaining watt-hours against a 2,100 Wh capacity, solar wattage from voltage × current, and efficiency relative to the panel's rated output.
(005)
Hardware & Engineering
Electron gave the interface direct Node.js access to serial ports, so GPS and sensor-controller data arrive inside the application with no separate bridge process. Context isolation and a preload bridge expose only the required IPC methods to the React interface, rather than opening Node up to the renderer.
I throttled cloud writes deliberately: telemetry every 15 seconds, GPS every 5. That keeps visibility near real time without inflating database activity. Reporting is local-first, so the app summarizes hourly telemetry snapshots into daily reports and keeps the most recent 40 days.
Mobile pairing is time-bound. A 10-character code and QR code regenerate every 90 seconds, and the pairing API validates expiry, consumes the code after use, and issues a Firebase custom token scoped to that vehicle.
(006)
Outcome
The result turns low-level EV sensor data into a clear operational dashboard: energy usage, solar contribution, battery health, and vehicle position, on the vehicle display and through synchronized mobile access.
I designed and implemented the whole monitoring workflow: the React interface, Electron hardware integration, telemetry calculations, GPS mapping, local reporting, Firebase synchronization, and QR-based device pairing.
Thanks for reading.